Market Data
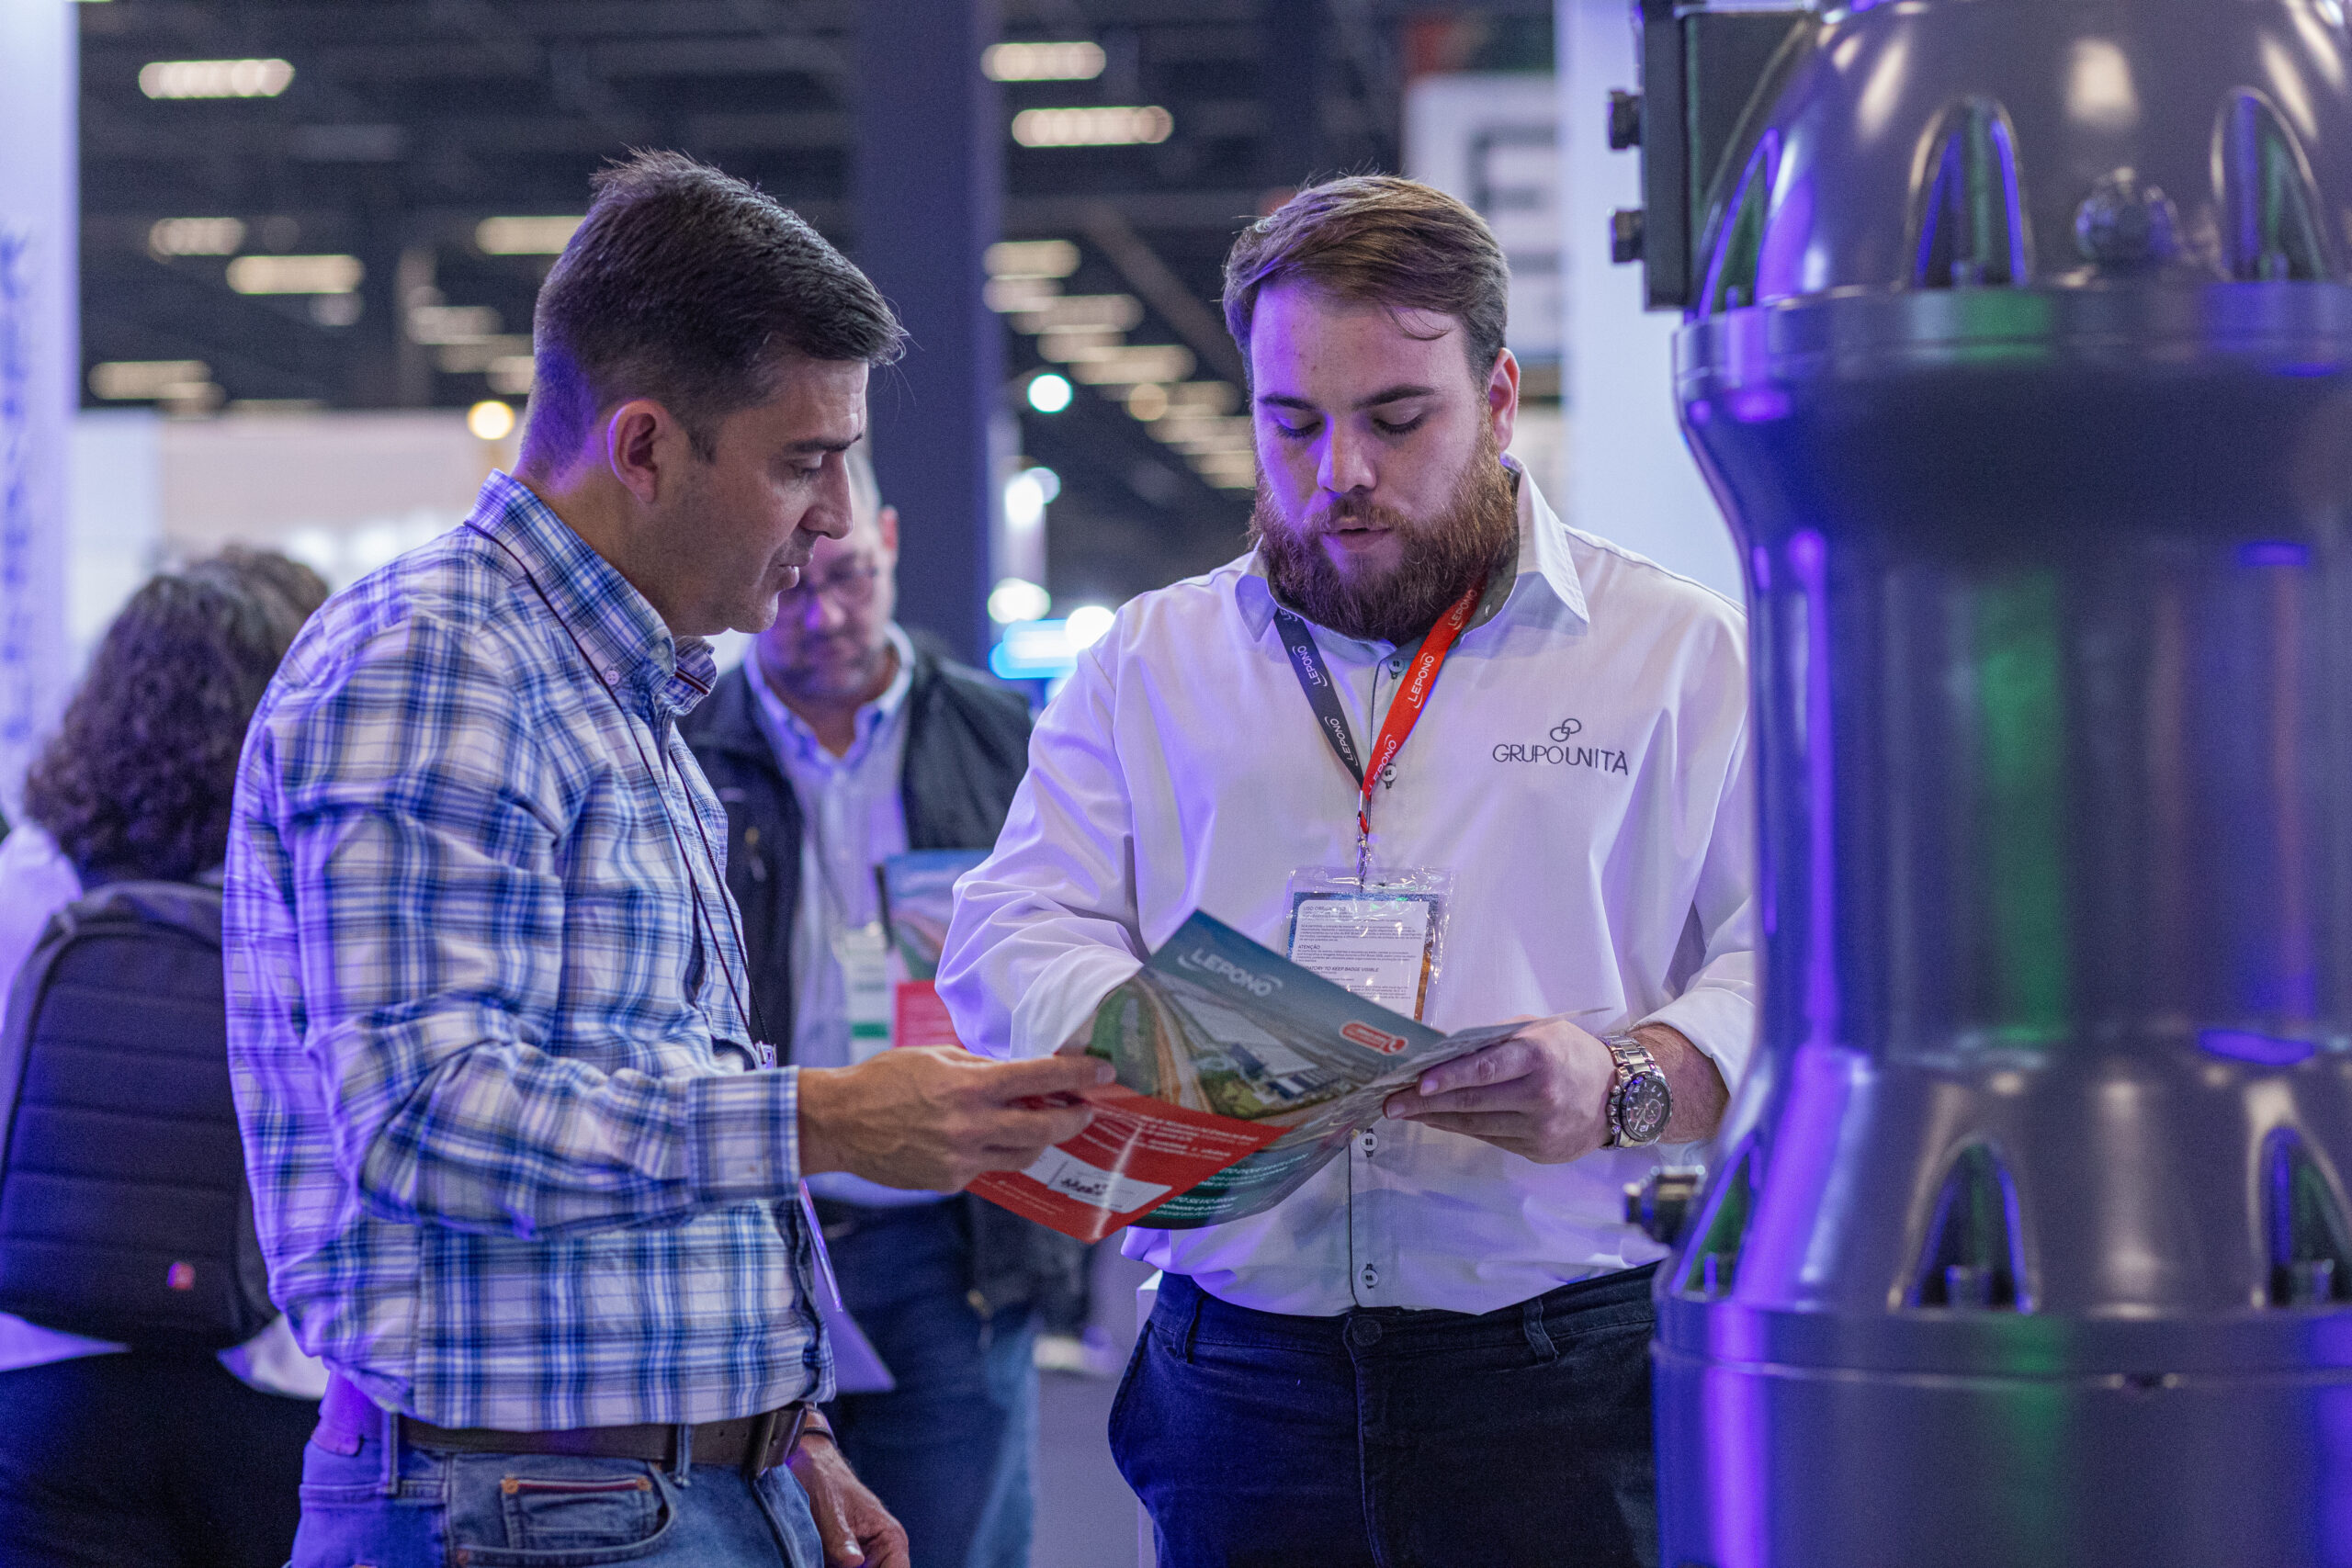
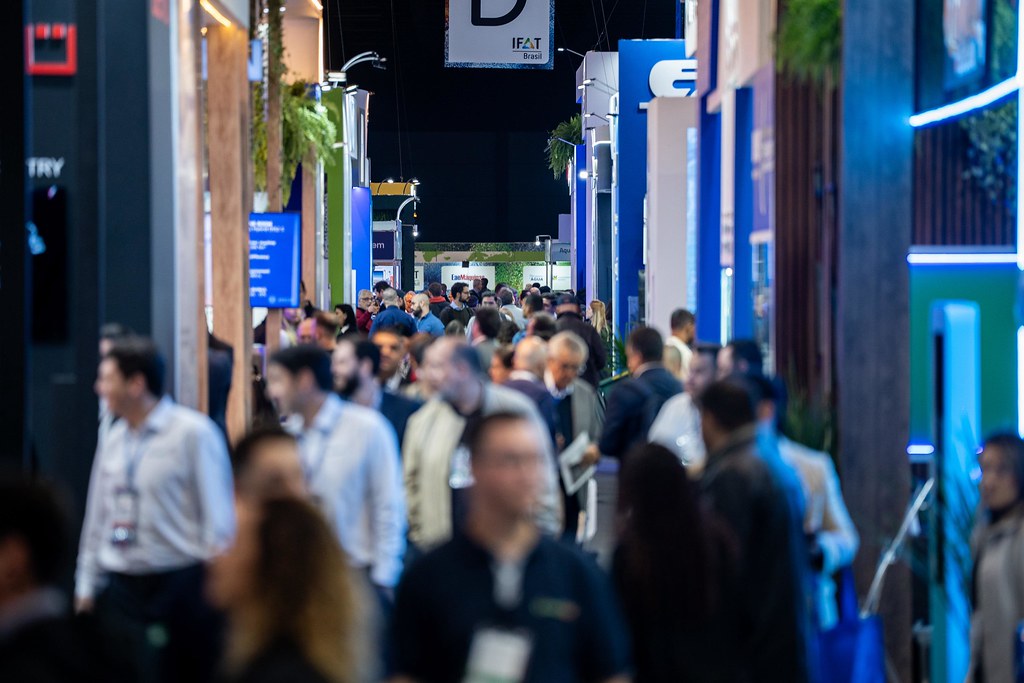
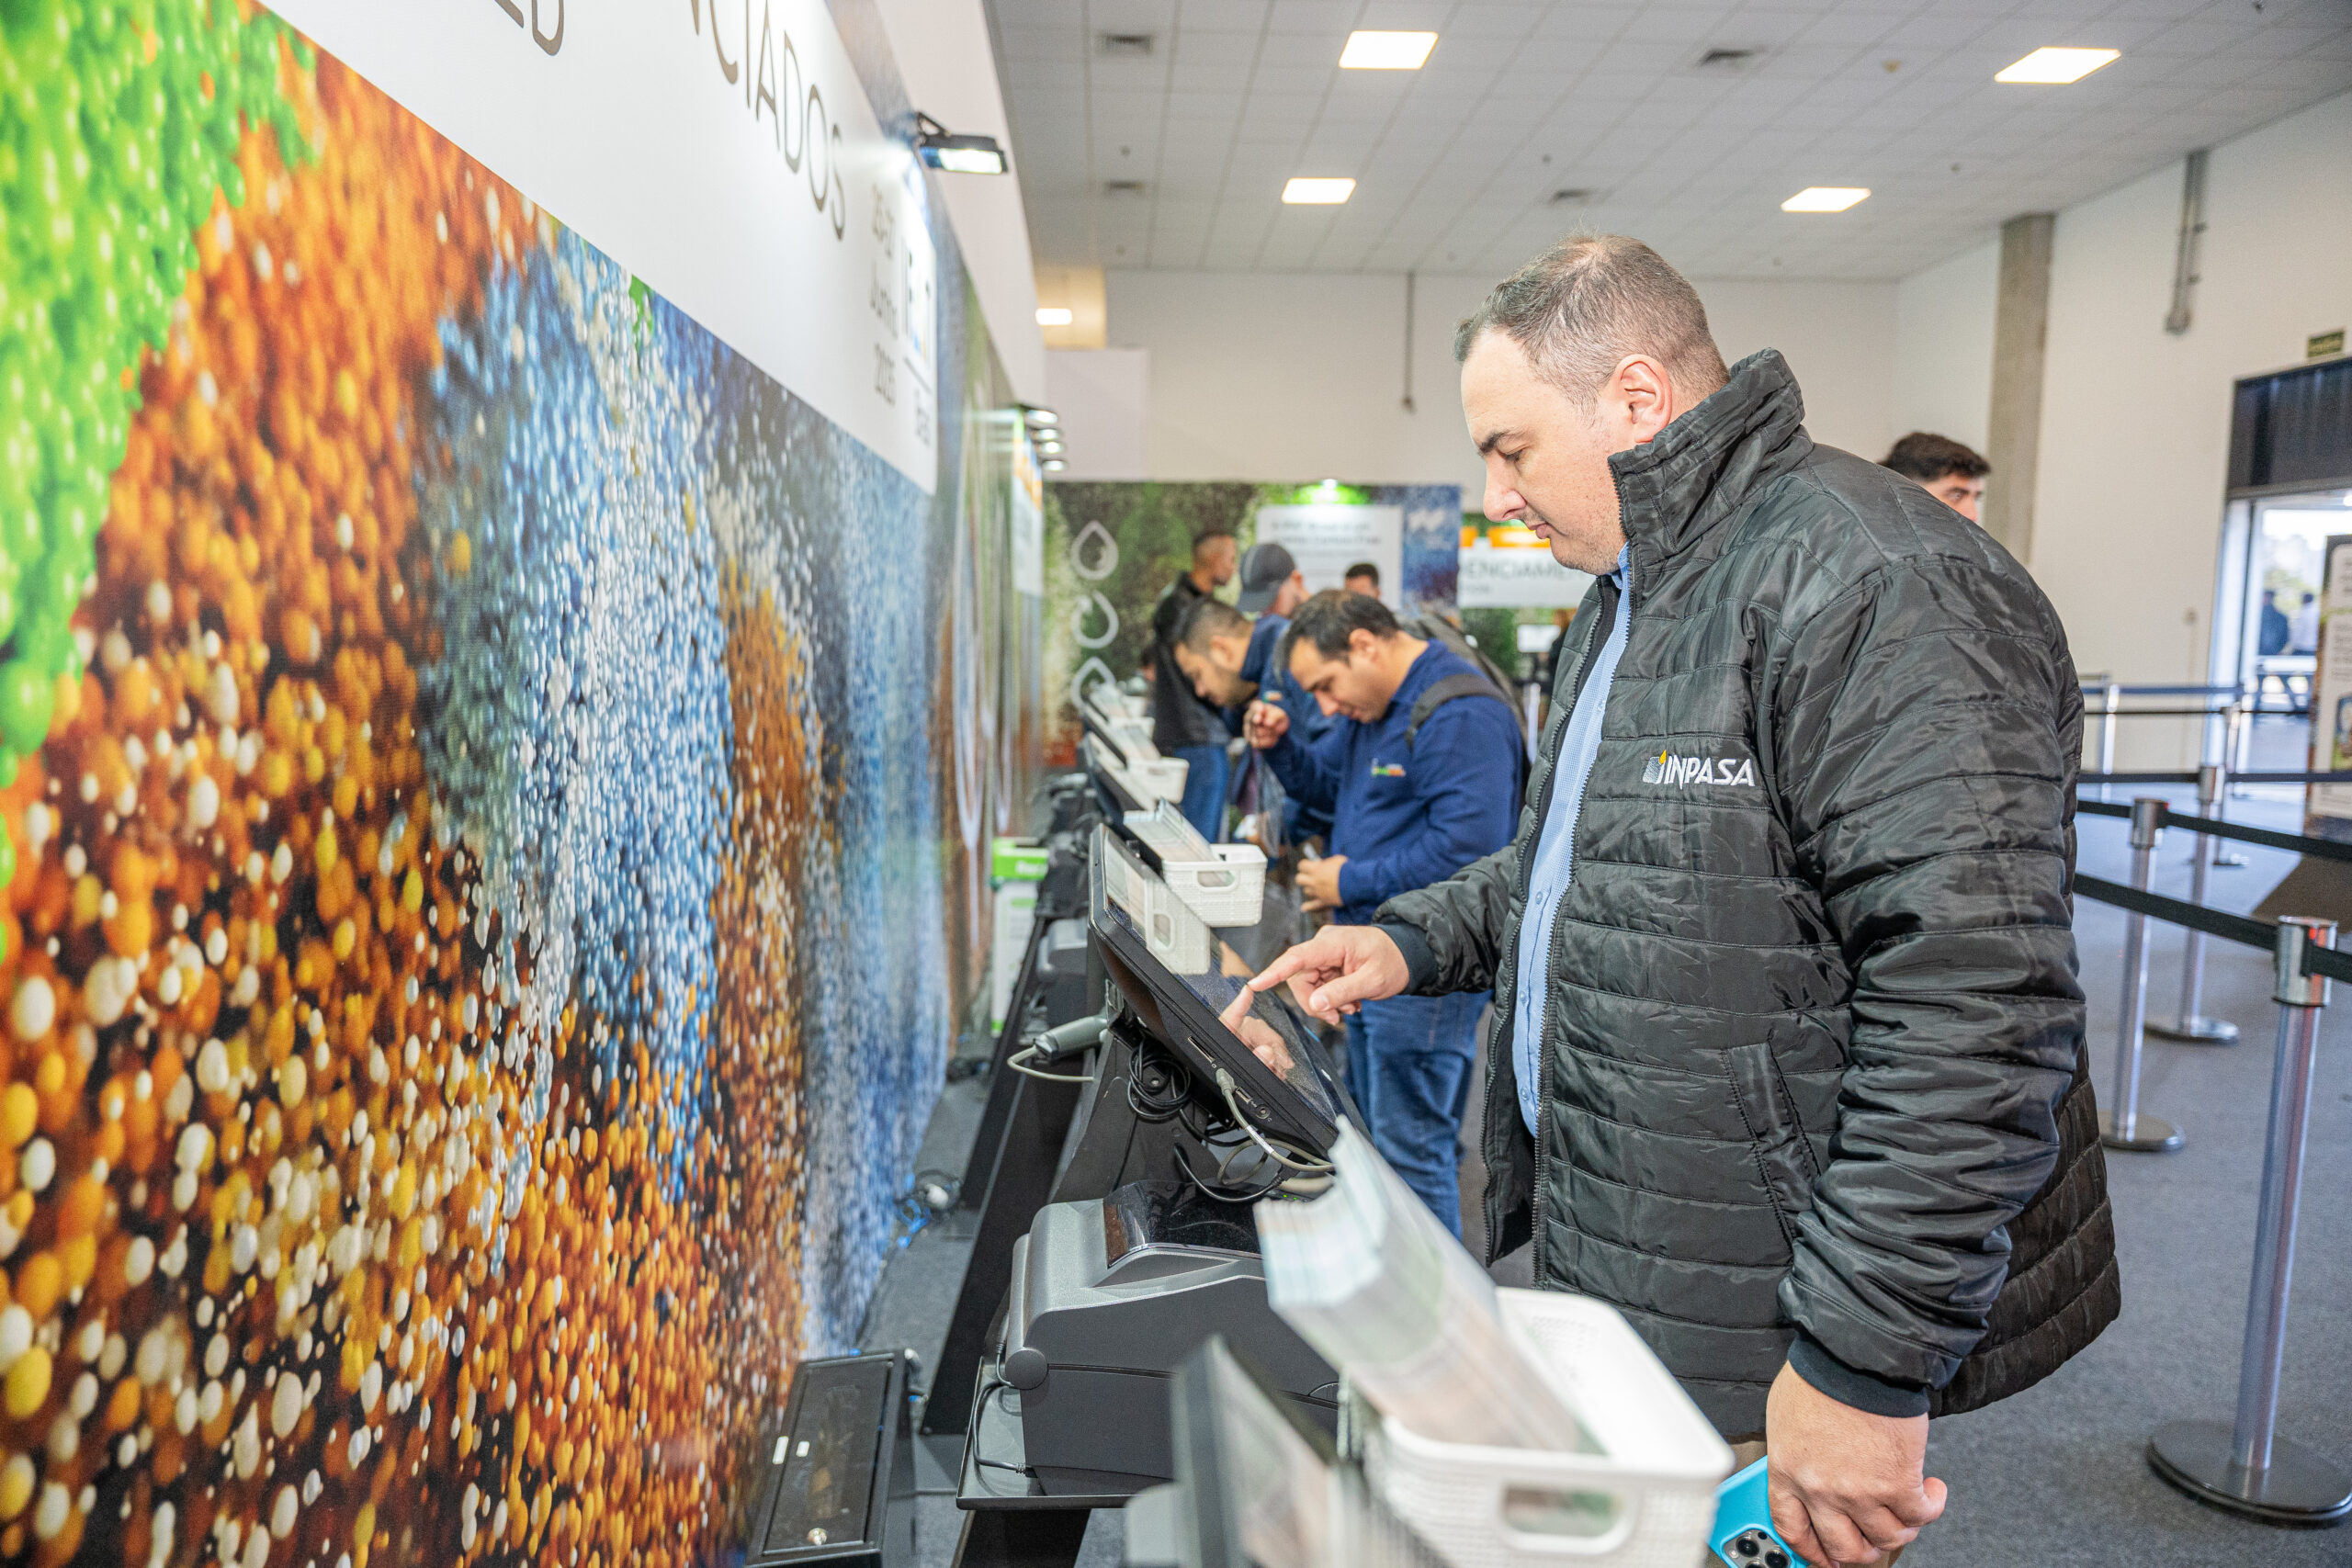
Highlights from IFAT Brasil 2025
Brands connected by a purpose: to impact the entire industry and bring benefits to the entire population
Exhibition area
0
m²
attendees from 34 countries and all Brazilian states
0
Exhibitors and 272 brands from 34 countries - an increase of 54% compared to the last edition
0
in business generated during the fair
BRL
0
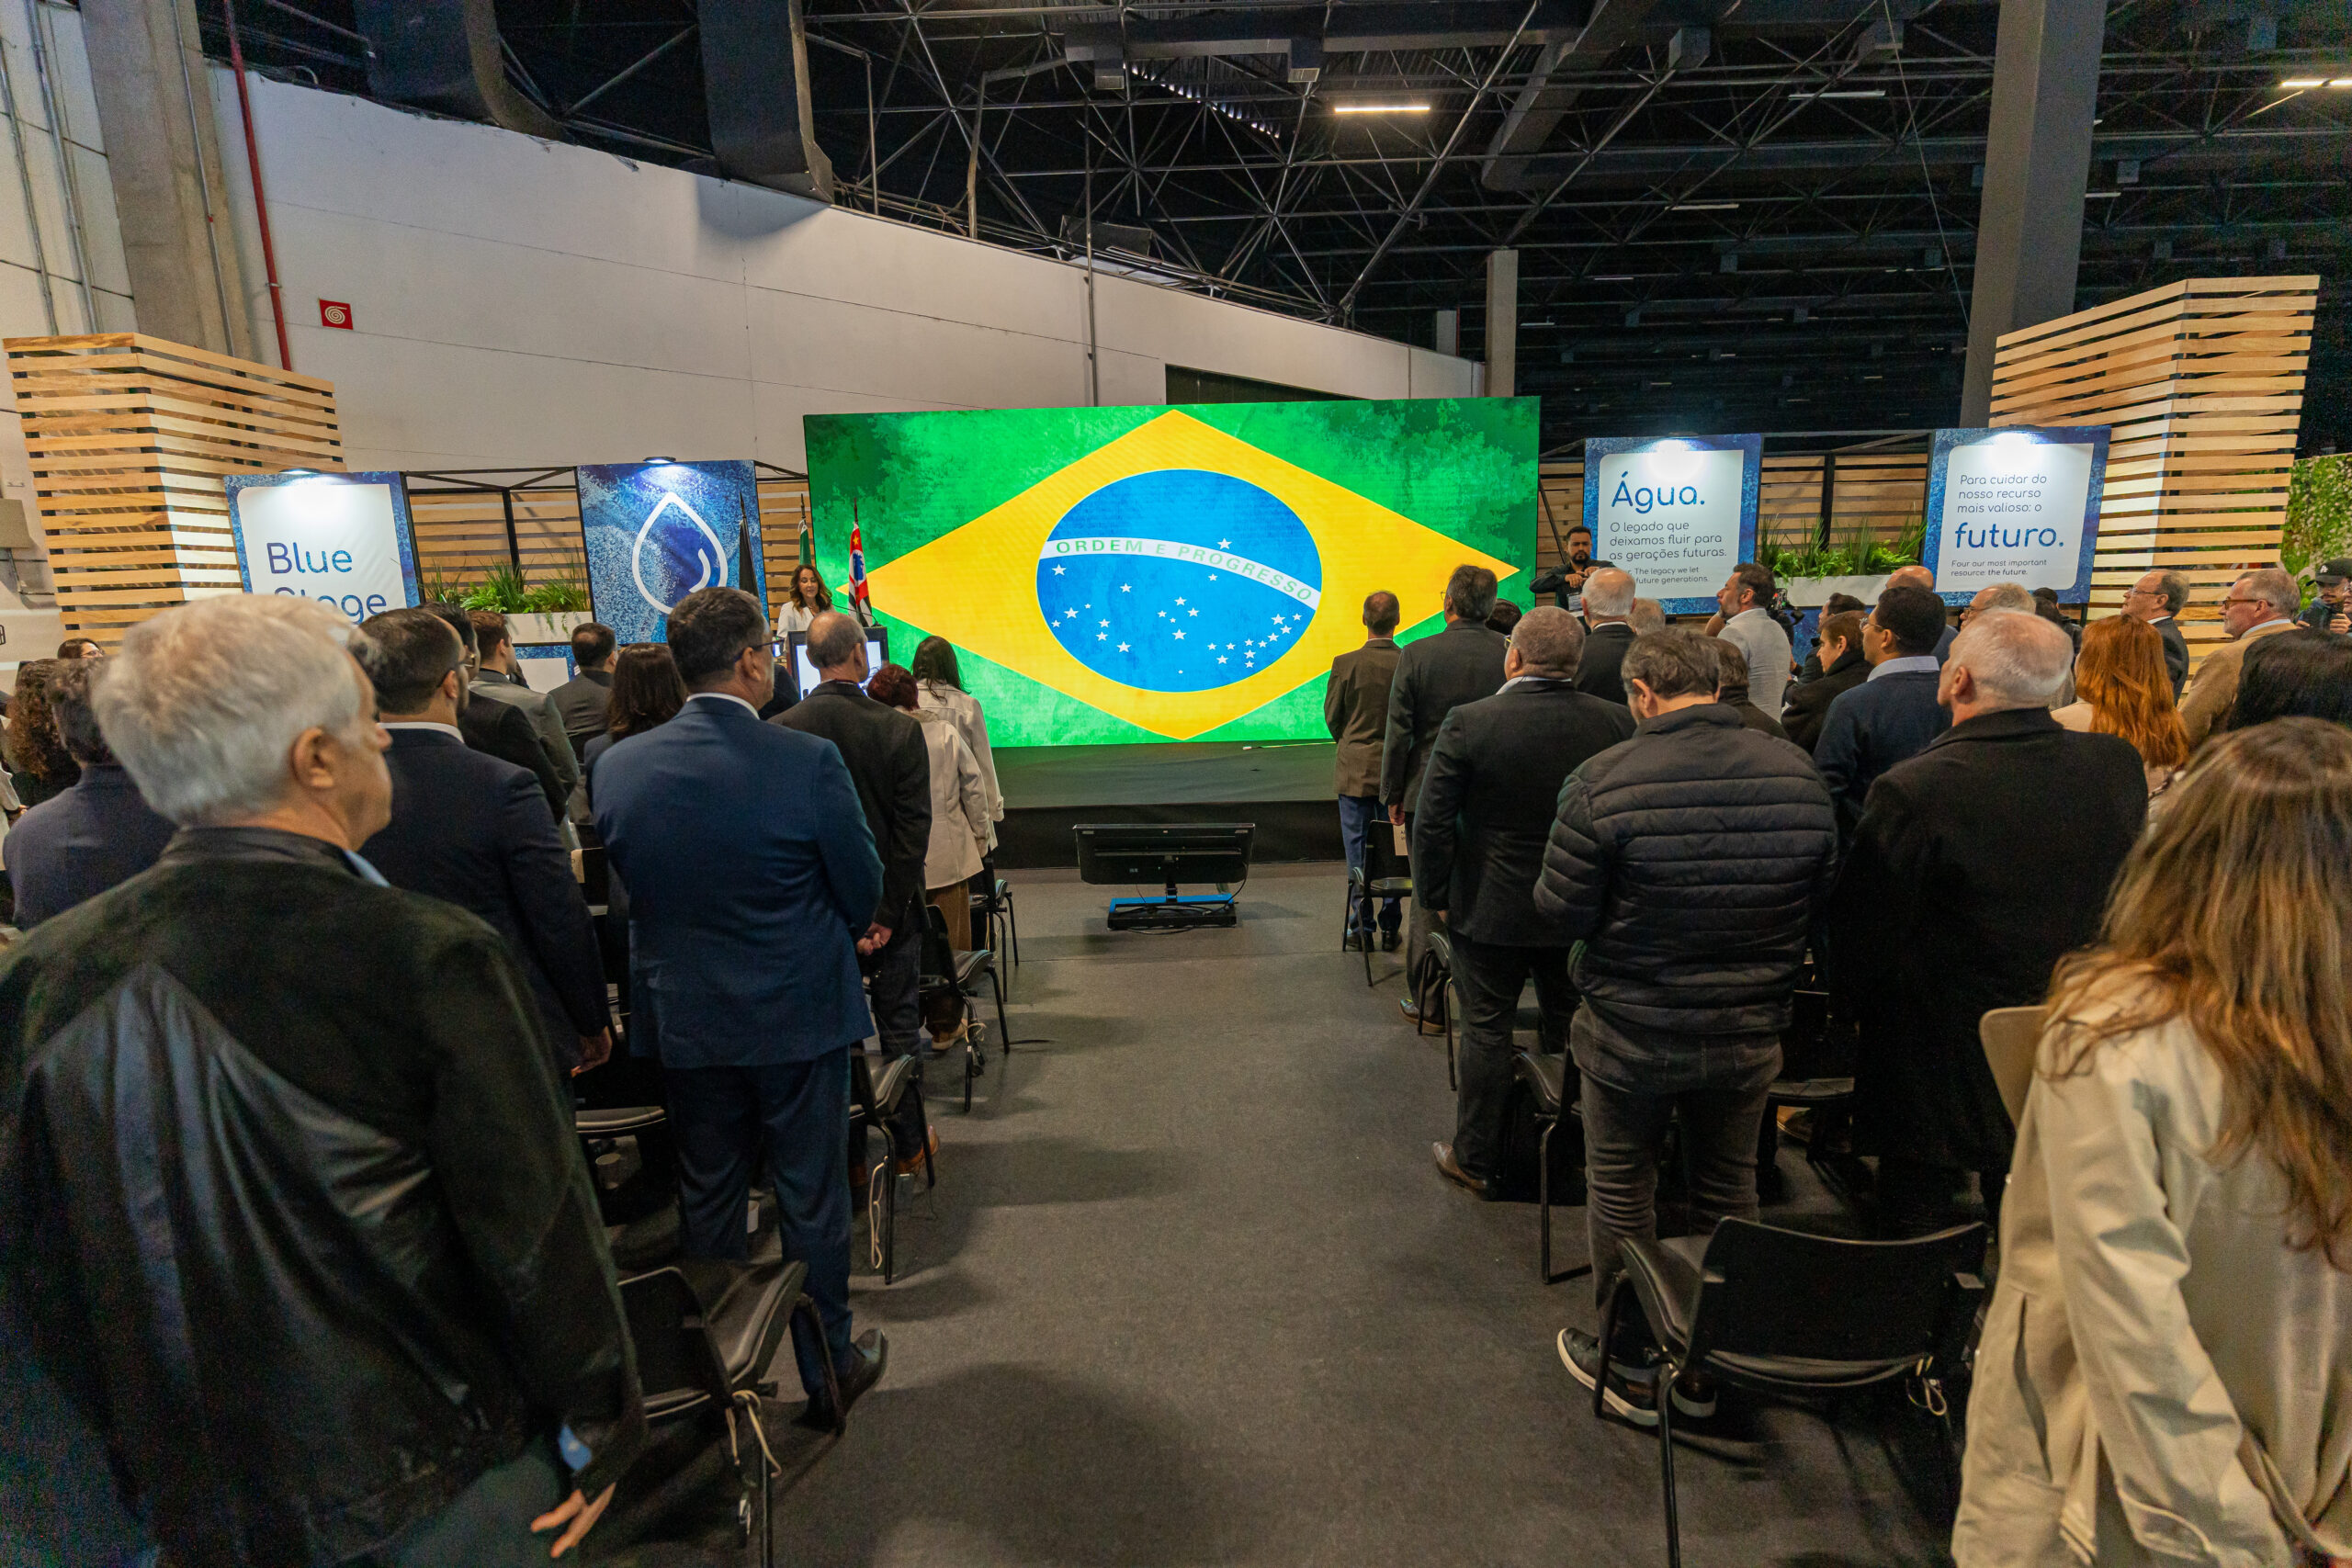
hours of free technical content and 217 national with international speakers
0
International visibility in Argentina, Bolivia, Chile, Colombia, Paraguay, Peru, and Uruguay
accesses to the site
0
ROI in spontaneous media with an audience of 27,815,135 people
BRL
0
people reached and 212,000 clicks on social networks and Google campaigns
0

14,000 social media followers – a 152% growth compared to the previous edition
0
journalists from national and international media covering the event
0

influencers and official ambassadors promoting the event
0
Market trends for Environmental technologies
History of external investments in sanitation
R$ 34.916.640.518,28
1992 – 2020
R$ 90.000.000.000,00
2020 – 2022
Investment projection by sector until 2033 in Brazil
IFAT Brasil has the industries for all the solutions and opportunities for the growth of the environmental technologies market in Brazil
Water Management
BRL 66.794.901.136,57
Waste Management and Energy Recovery Solutions
BRL 226.636.696.188,16
Drainage and Sanitation Infrastructure
BRL 177.567.876.543,88
Sewage Management
BRL 108.499.624.679,78
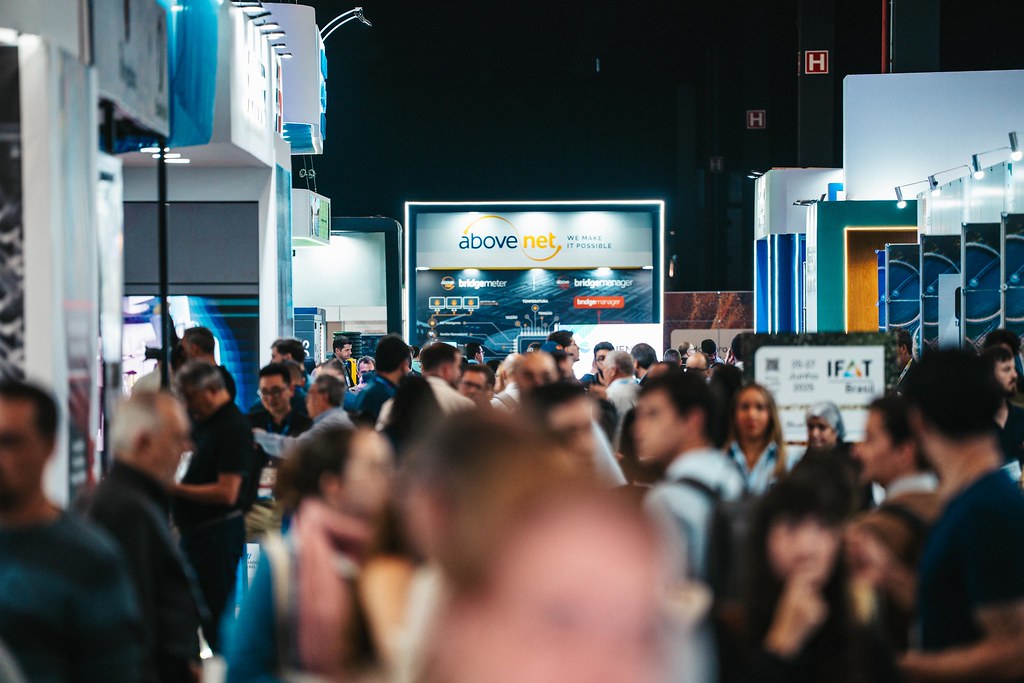
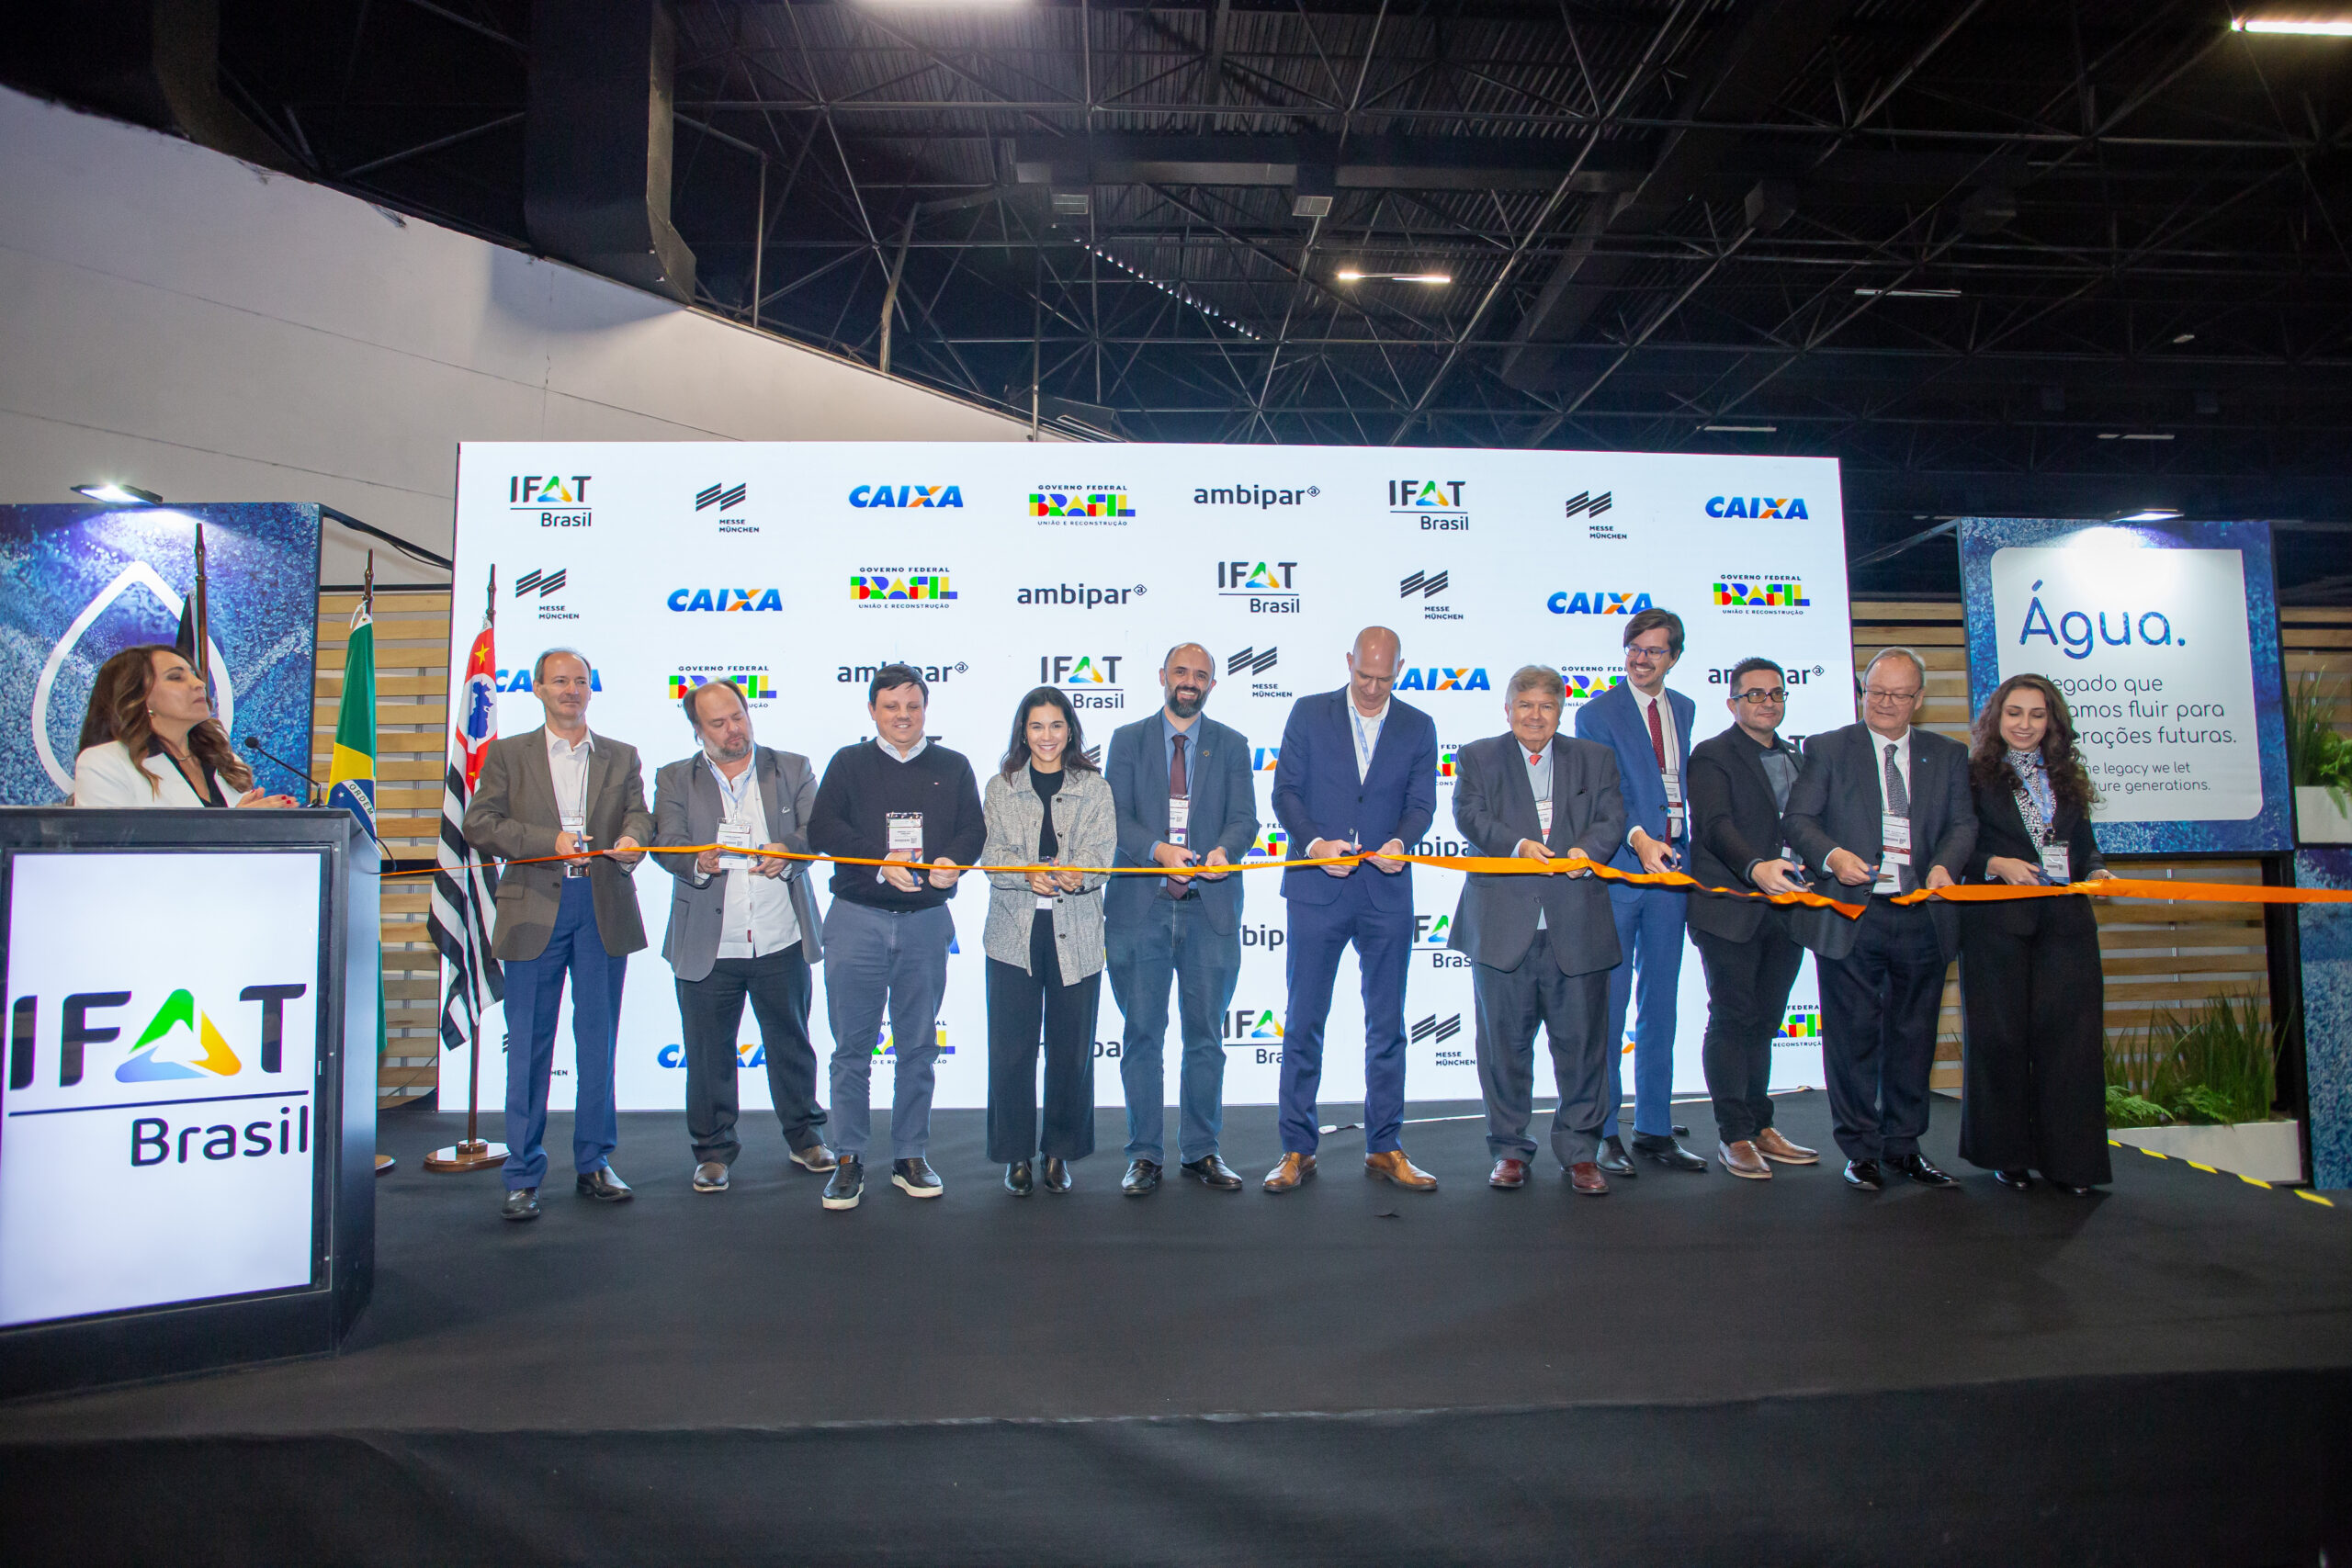
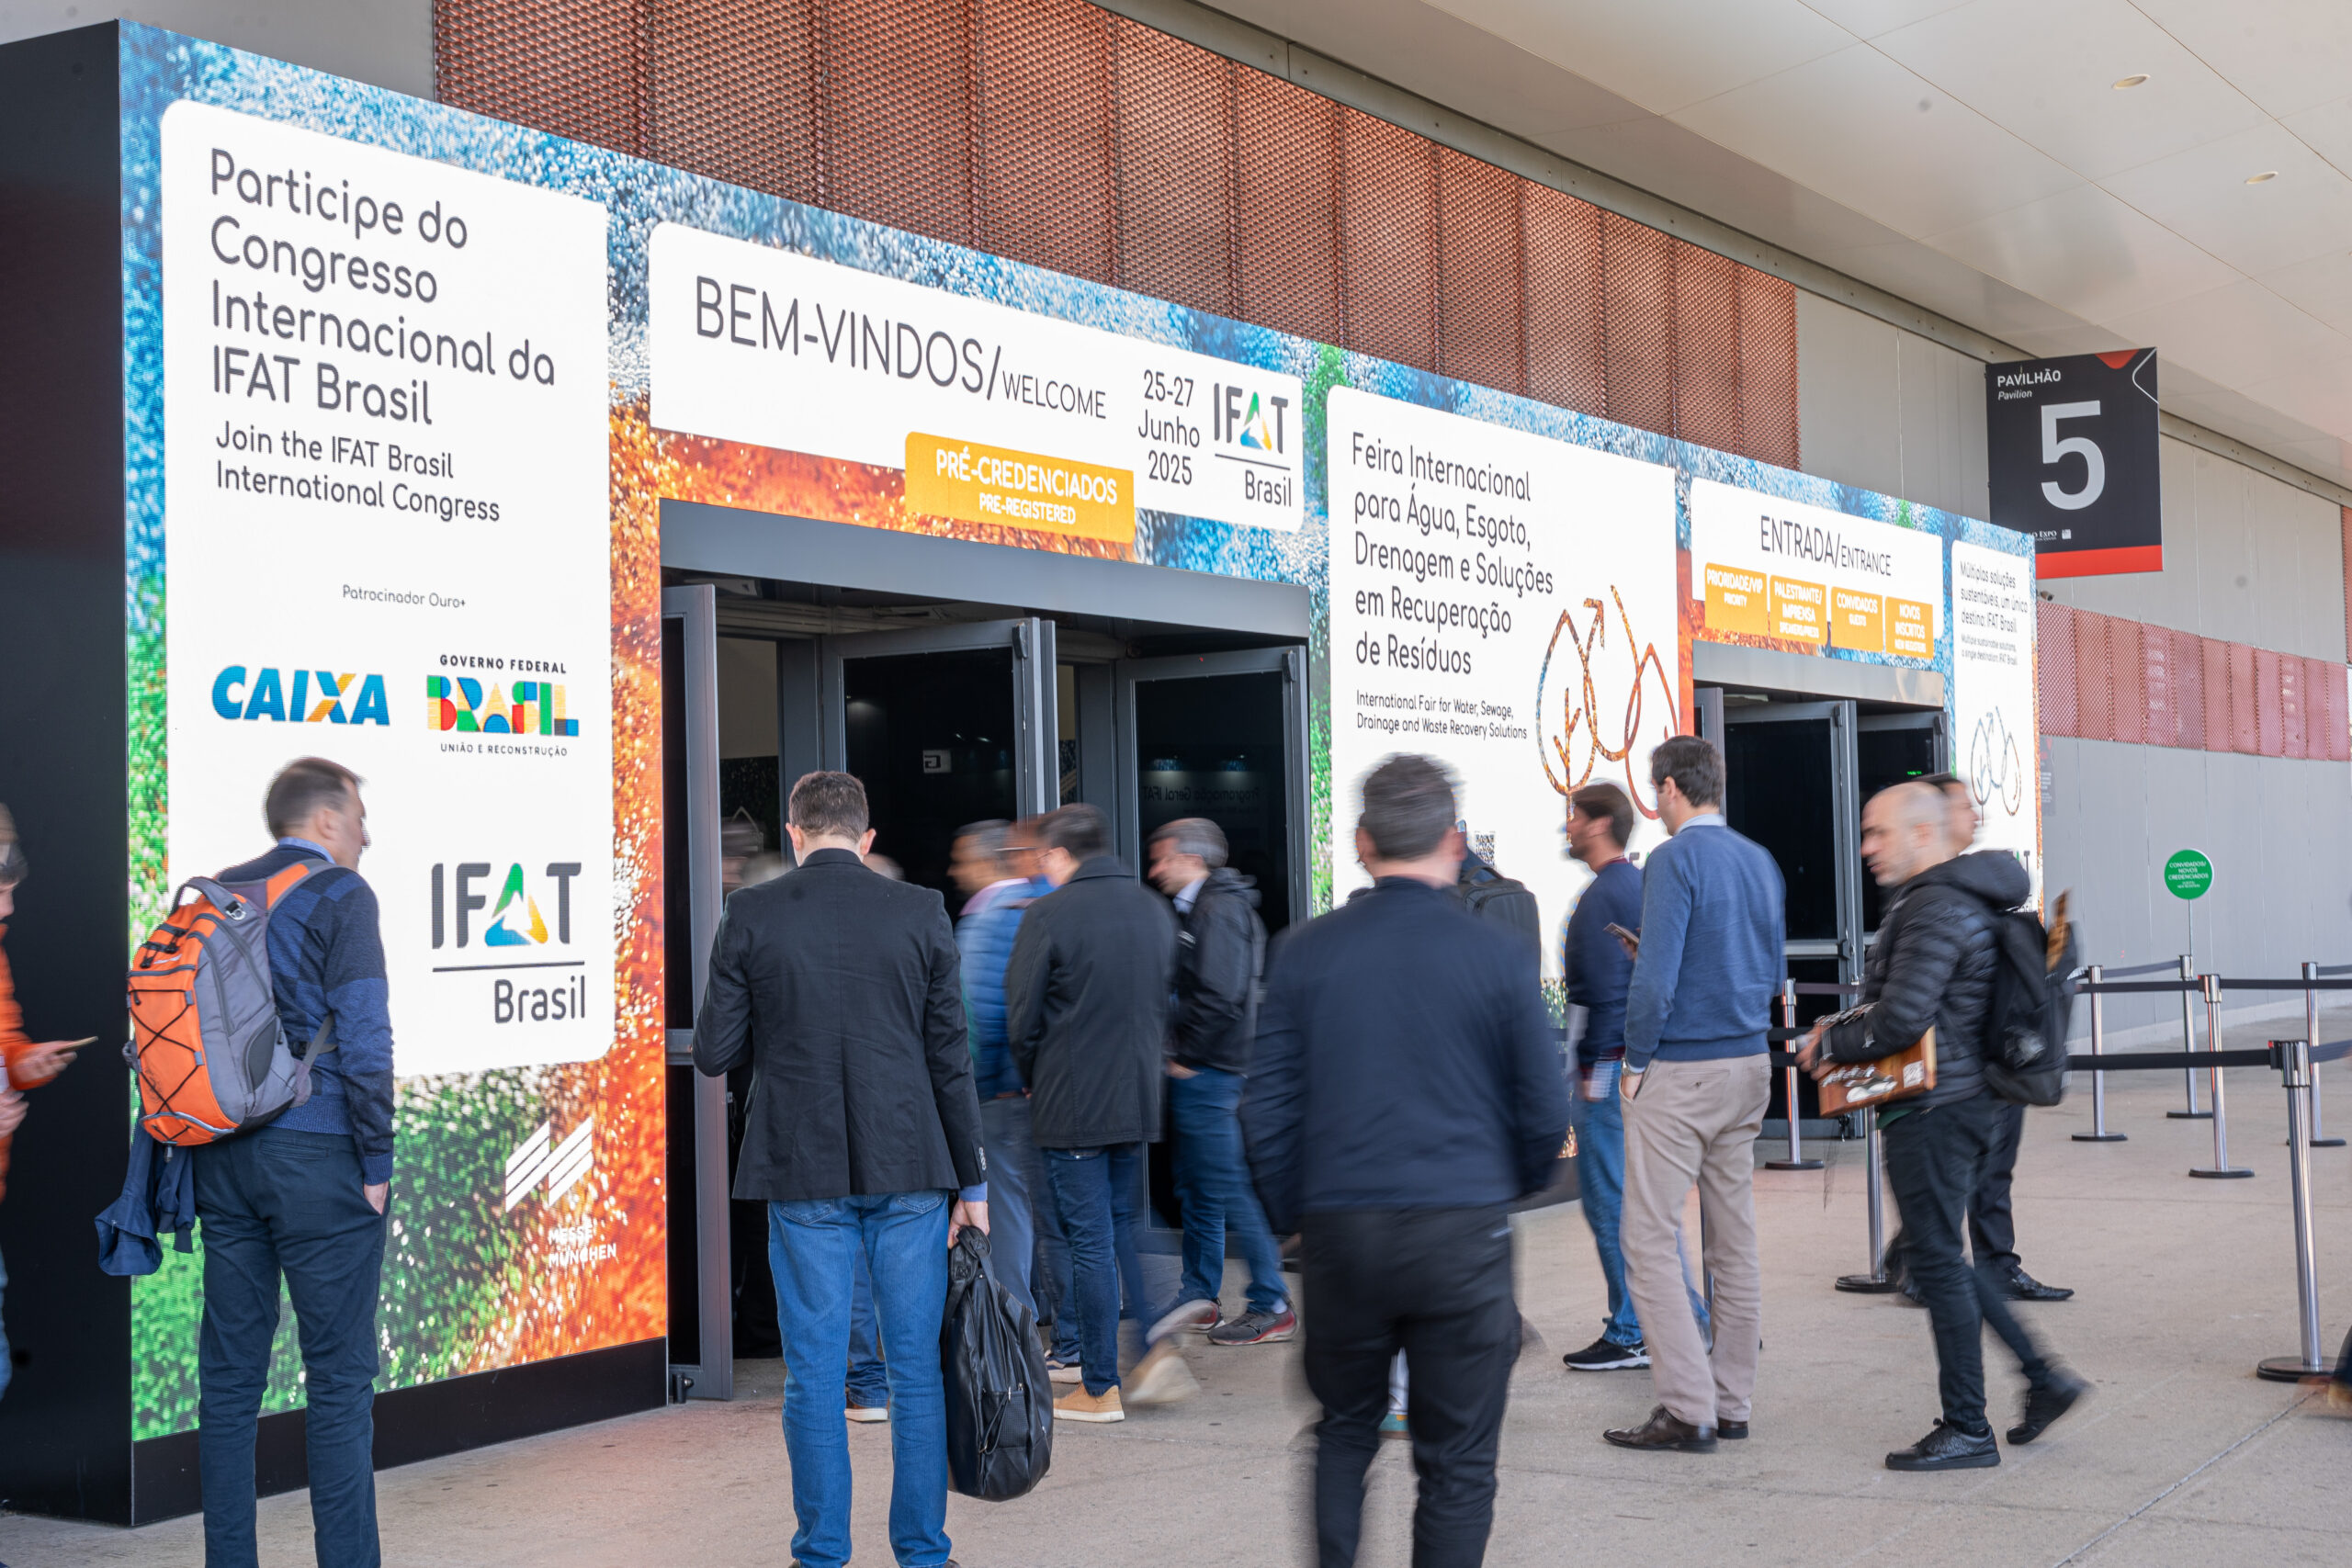
IFAT Brasil 2025 Facts and Figures
- 20,000 attendees from all Brazilian states and 34 countries
- Over 22,000 m² of occupied area
- 230 exhibitors and 272 brands from 34 countries – a 54% growth compared to the previous edition
- Approximately R$1 billion in business generated during the trade fair
- 79 hours of content with 217 national and international speakers
- International visibility in Argentina, Bolivia, Chile, Colombia, Paraguay, Peru, and Uruguay
- 921,000 website visits
- ROI of over R$8.5 billion in earned media value
- Reach of over 1 million people and 212,000 clicks on social media and Google campaigns
- 14,000 social media followers – a 152% growth compared to the previous edition
- 66 journalists from national and international media covering the event
-
Receive news from IFAT Brasil
Do you want to receive the main news from the market and the main environmental technology event in Latin America?